Kalyani Nagaraj
 |
Kalyani Nagaraj, Ph.D. |
A Brief Bio
Prior to joining Oklahoma State Univesity's School of Industrial Engineering and Management as an Assistant Professor in 2016, I was a Visiting Assistant Professor in the Department of Statistics at University Purdue University from 2014 to 2016. I graduated with a Masters and a Ph.D. in Industrial and Systems Engineering (Operations Research) from Virginia Tech in 2008 and 2014, respectively, and a Bachelors in Engineering from University of Pune in 2007.
Research Highlights
I. Learning Methods for Synthesizing Social-Contact Networks
We develop a networked epidemiology framework to understand how targeted containment strategies can ebb the tide of an influenza-like disease epidemic in densely populated urban regions like the National Capital Territory of Delhi, India. A key contribution of this work is a methodology for the synthesis of a realistic individual-based social contact network (specifically for Delhi) using a wide variety of open source and commercial data. New simulation-based techniques were developed to infer daily activities for individuals using aggregate data published in transportation science literature, human development surveys, and targeted local surveys. An annotated map of Delhi in Figure 1 illustrates the daily travel patterns of a typical three-member family generated by our algorithm.
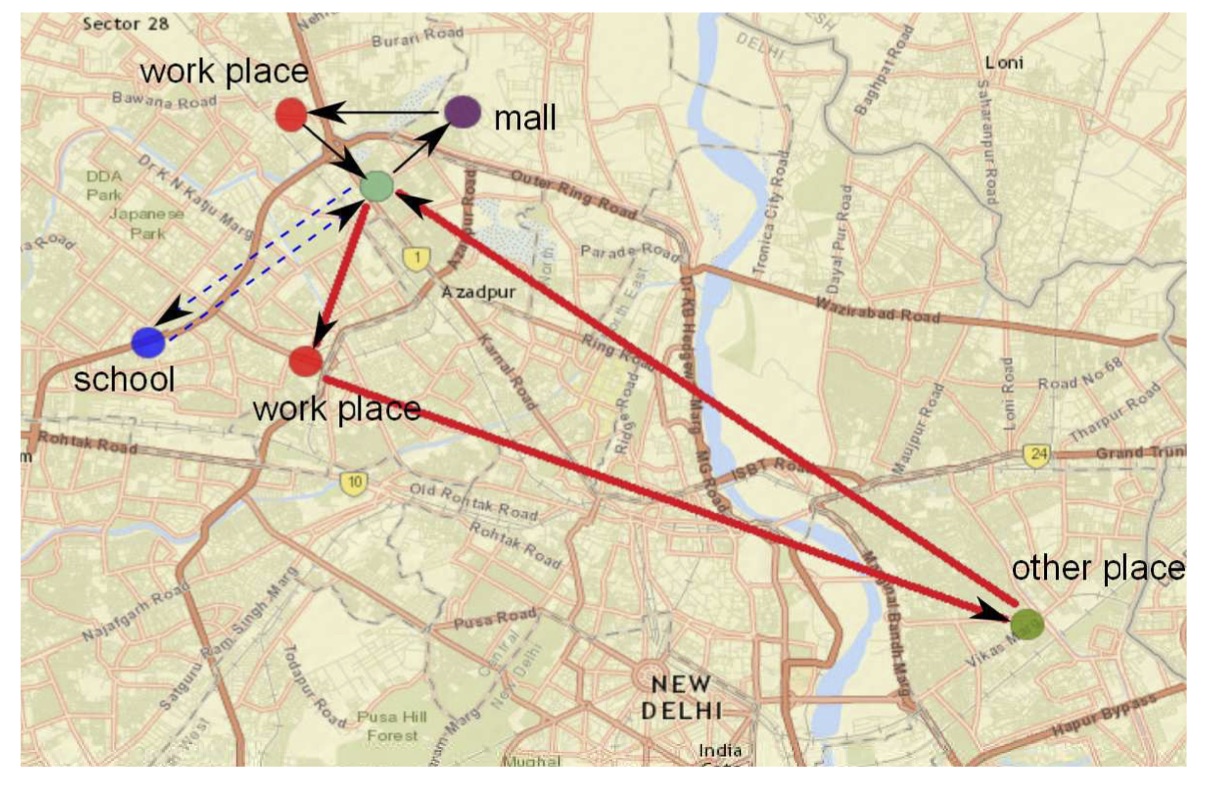 |
| Figure 1: Each member in this synthetically generated family has distinct travel “routes”, each marked with a different coloured line. The father's travel sequence – from home to work-place to another location and then back home – is marked in thick red lines. The mother (solid thin black lines) goes to the mall and then to work before heading back home. And their son travels only to school and back (dashed blue lines) on a typical weekday. |
The family's activity times, travel times, geo-coordinate data, all of which are also synthesized from existing survey and census data, are then used to infer people-to-people contacts. A contact is said to occur between two persons if their times at a location overlap. The resulting social contact network is the first such network constructed for any urban region of India. This time varying, spatially explicit graph network has over 13 million people with more than 200 million person-to-person contacts. We test this network using a high performance agent-based simulation to study how an influenza-like illness would spread over Delhi, and how a combination of well-understood pharmaceutical and non-pharmaceutical containment strategies can contain a possible pandemic.
II. Simulation Optimization
Stochastic simulations are increasingly used to model complex, real-world systems like weather, financial markets, and emergency health care systems. The outcomes of these simulations (for example, the number of people that will be affected by an emerging pandemic) are naturally subject to uncertainty. Moreover, they often have no known functional form. The optimization questions that then arise (for example, how to minimize the casualty count in a pandemic with the right containment strategies), and the development of simulation-based methodology that brings about these desired efficiencies, has become a research area of great importance.
A large majority of simulation optimization (SO) problems encountered in real-world scenarios involve integer decision variables. In optimization problems that arise in health care and manufacturing, both the objective function and the constraint functions defining the feasible region are estimated via a stochastic simulation. For instance, consider the problem of minimizing the total staffing cost of an emergency care unit while satisfying a prescribed service level. Then for a suggested staffing policy, both the cost and the service level are best estimated via a stochastic simulation.
Solutions to problems of resource allocation, like the staffing problem, tend to have binding constraints. This happens because the objective function pushes the optimal solution against a resource boundary. Ascertaining feasibility of a boundary solution from simulation estimates is a nontrivial challenge – see Figure 1 and Movies 1 and 2. We propose the provably convergent algorithm cgR-SPLINE for this broad class of SO problems.
cgR-SPLINE is a global solver that sequentially restarts a local solver from randomized initial locations. During each local search, cgR-SPLINE iteratively solves a sequence of ε–relaxed sample-path problems. When the local search ends (termination occurs when a predetermined simulation budget — that grows with every subsequent restart — is exhausted), cgR-SPLINE returns a local solution estimate. This local solution is probabilistically compared against the incumbent to obtain a global solution estimate.
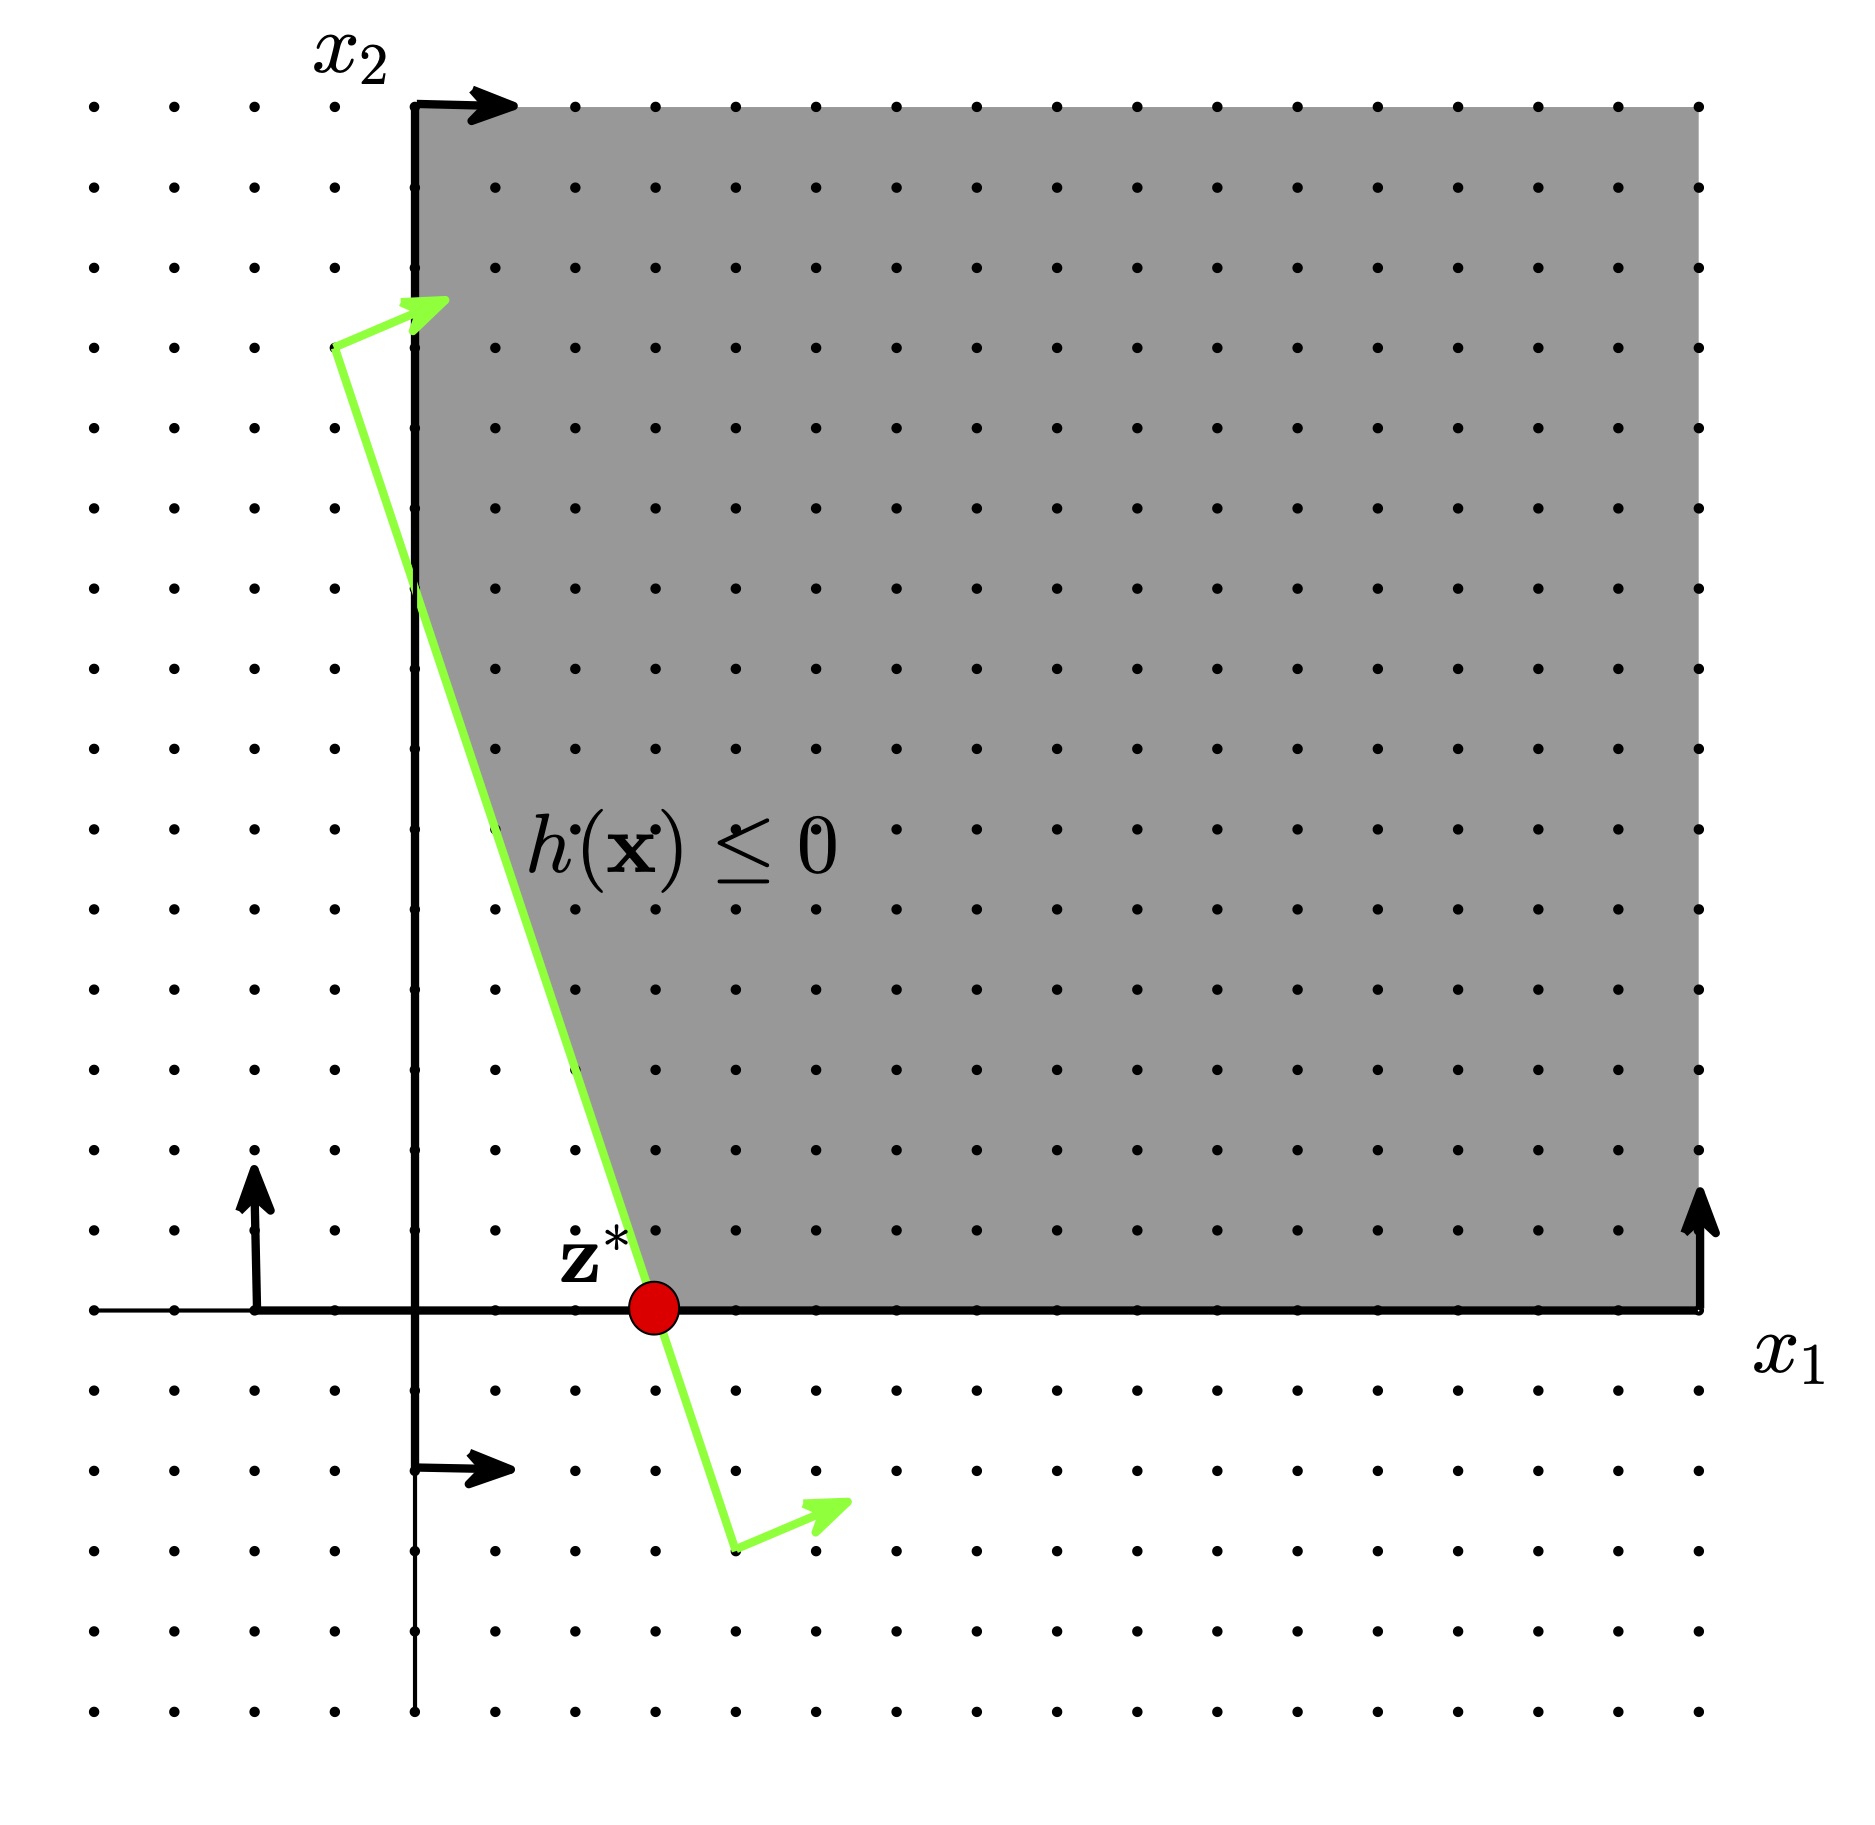 |
| Figure 2: The shaded area marks the feasible region of a toy optimization problem whose solution is indicated with a red dot at point (3, 0). For simplicity, let us assume that the underlying simulation generates standard normal random variates for the constraint function h at all points x in the search space. |
| Movie 1: The sample average estimator of the constraint function at point (3, 0) equals 0.5 no matter how large the sample size m. So any solver that naively tests for feasibility in this fashion correctly identifies the boundary solution (0, 3) exactly 50% of the time, for any sample size m. | Movie 2: Feasibility of the point (3, 0) (and consequently the consistency and efficiency of cgR-SPLINE) is guaranteed when the ε–relaxations in the sample-path constraints are progressively reduced to zero at a rate slower than the rate at which the standard error of the constraint estimate drops to zero. Notice that the probability with which the point (3, 0) is deemed feasible (this is the shaded area under the curve) approaches 1 as the sample size increases. For illustrative purpose, ε in this movie is simply set to equal m^(-0.4). |
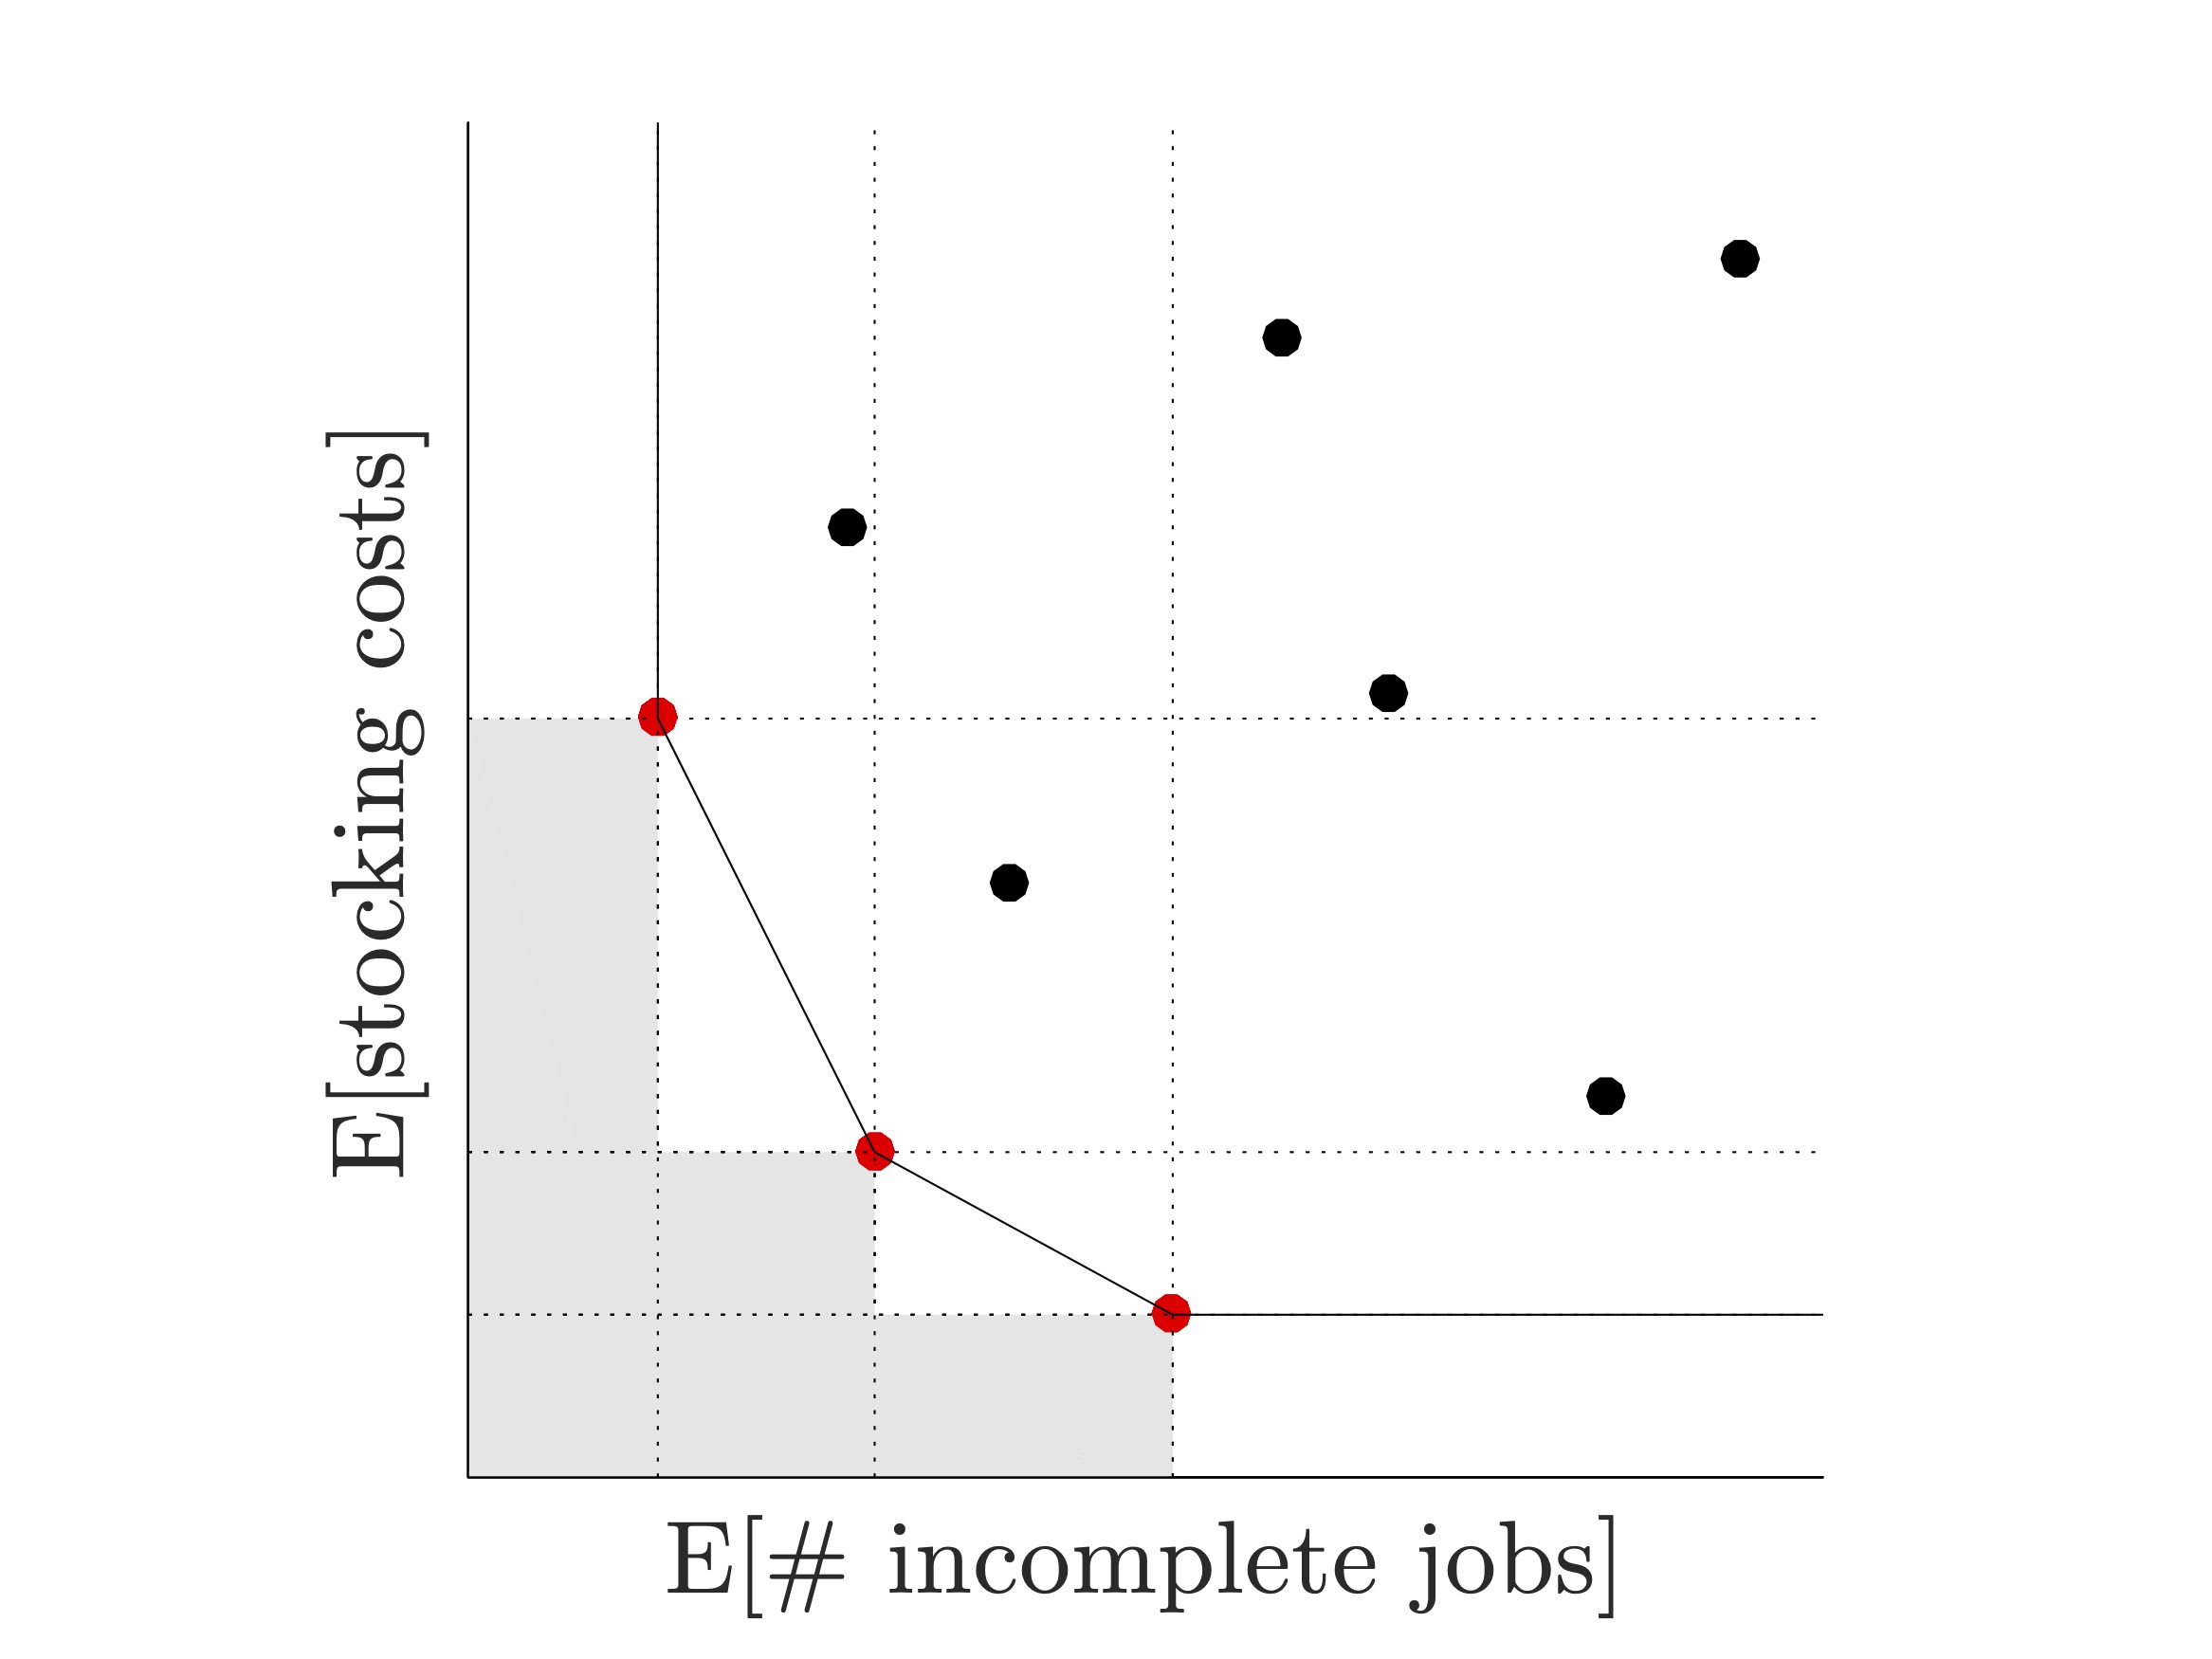
Instead of seeking a single solution to a constrained optimization problem, decision makers are often interested in identifying several ‘‘efficient" solutions to multiple conflicting objectives. For example, in aircraft maintenance scheduling, these multiple objectives could be the minimization of the cost associated with the stocking of spare parts and the minimization of the expected number of maintenance jobs that are not completed in time.
Our solver R-PεRLE, retrieves the so-called Pareto set of non-dominated solutions to a bi-objective simulation optimization problem by solving several constrained single objective SO problems. This is achieved in the following way. A single performance measure, for instance, the expected inventory cost, is chosen to be optimized. The remaining performance measure (in the above example, the expected number of incomplete jobs) is then pulled into a constraint by imposing strategically chosen upper and lower bounds. Multiple instances of this problem are solved simultaneously by appropriately varying the bounds on the constraint.
 |
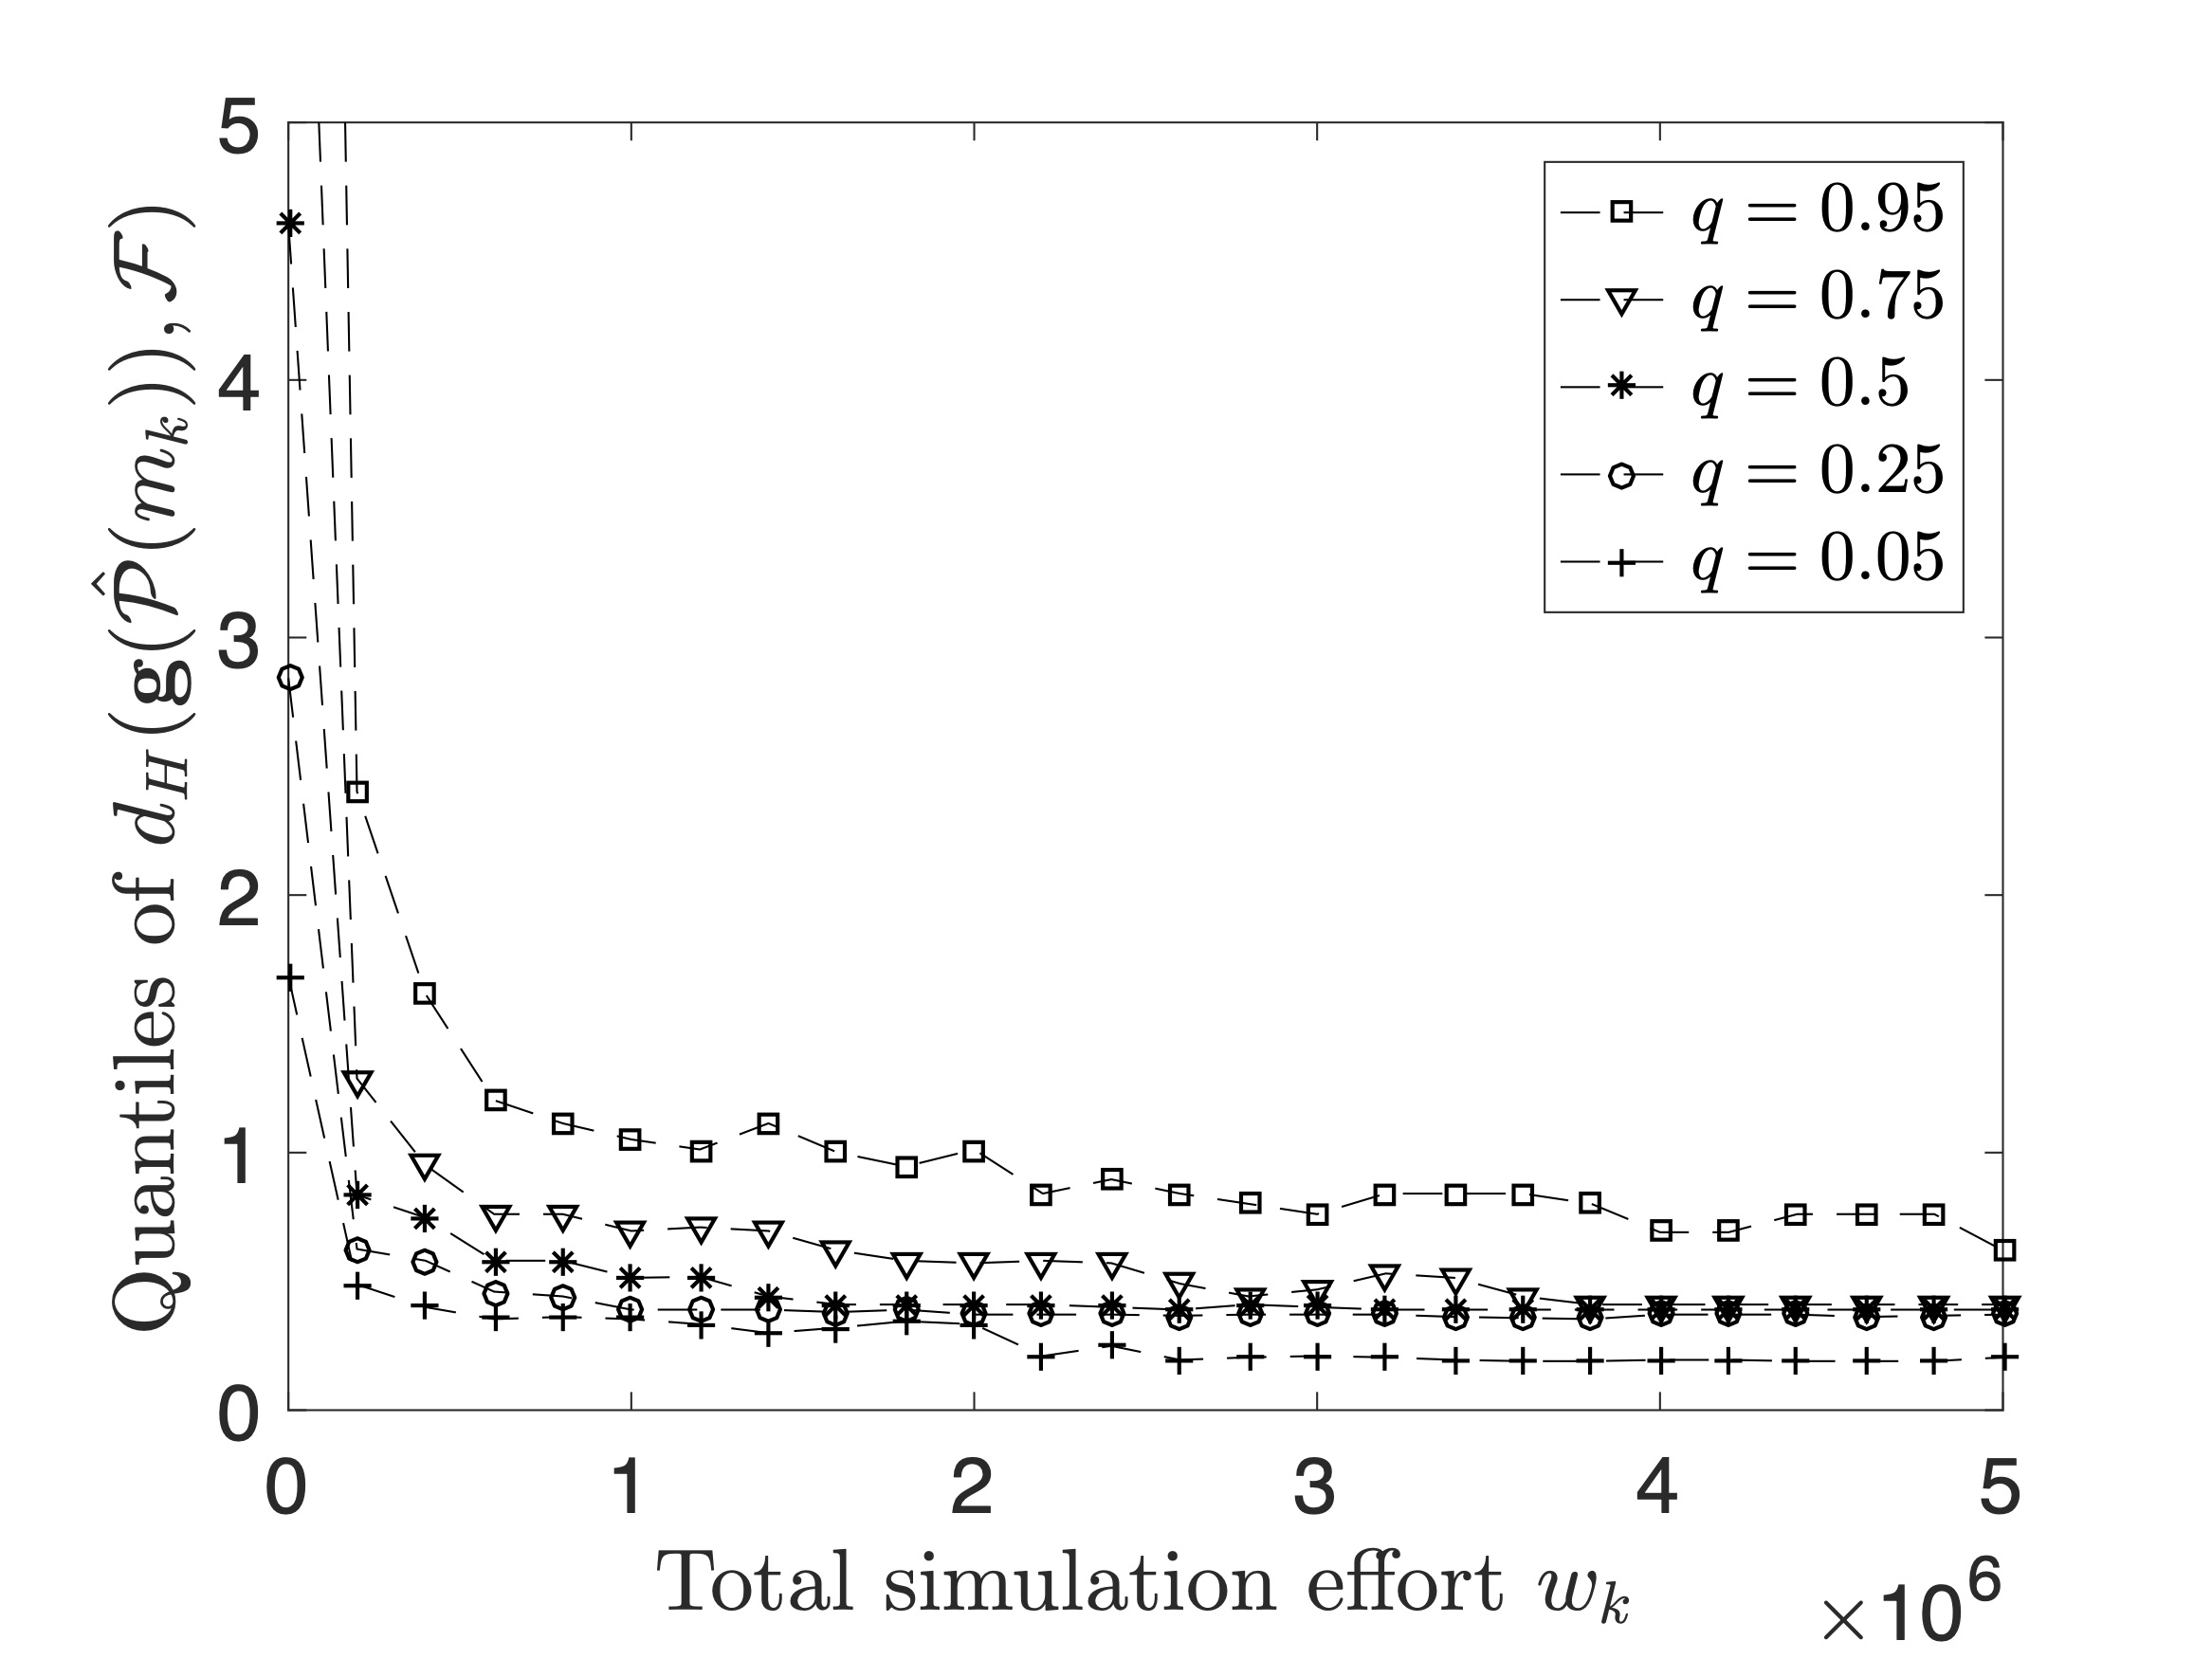 |
| Figure 3(a): An illustration of the bi-objective aircraft maintenance scheduling problem. Solid red dots indicate efficient solutions, also known as non-dominated or Pareto solutions. A solution is said to be efficient if there exists no other solution that is relatively better in all objectives. | Figure 3(b): Numerical experiments on a nontrivial test problem: the graph shows the Hausdorff distance between the true and estimated Pareto sets as a function of total simulation effort. In the limit, R-PεRLE retrieves the true Pareto set and the distance metric converges to zero (almost surely). |
III. Rare Event Estimation
Efficient sampling methods for rare event probability estimation can be of vital importance in scenarios where the event of interest has a very low likelihood of occurrence but which results in losses of significant magnitude. For example, in finance, accurately estimating the probability that a low-risk, high-reward portfolio defaults, and in critical infrastructure planning, estimating system breakdown probabilities.
We develop a suite of efficient estimators using ideas from importance sampling for NORTA (Normal-To-Anything) distributions that have a known covariance structure. The construction of one such estimator, called the partial information estimator, is illustrated below. Extensions to this work in network simulations and stochastic diffusions are topics of ongoing work.
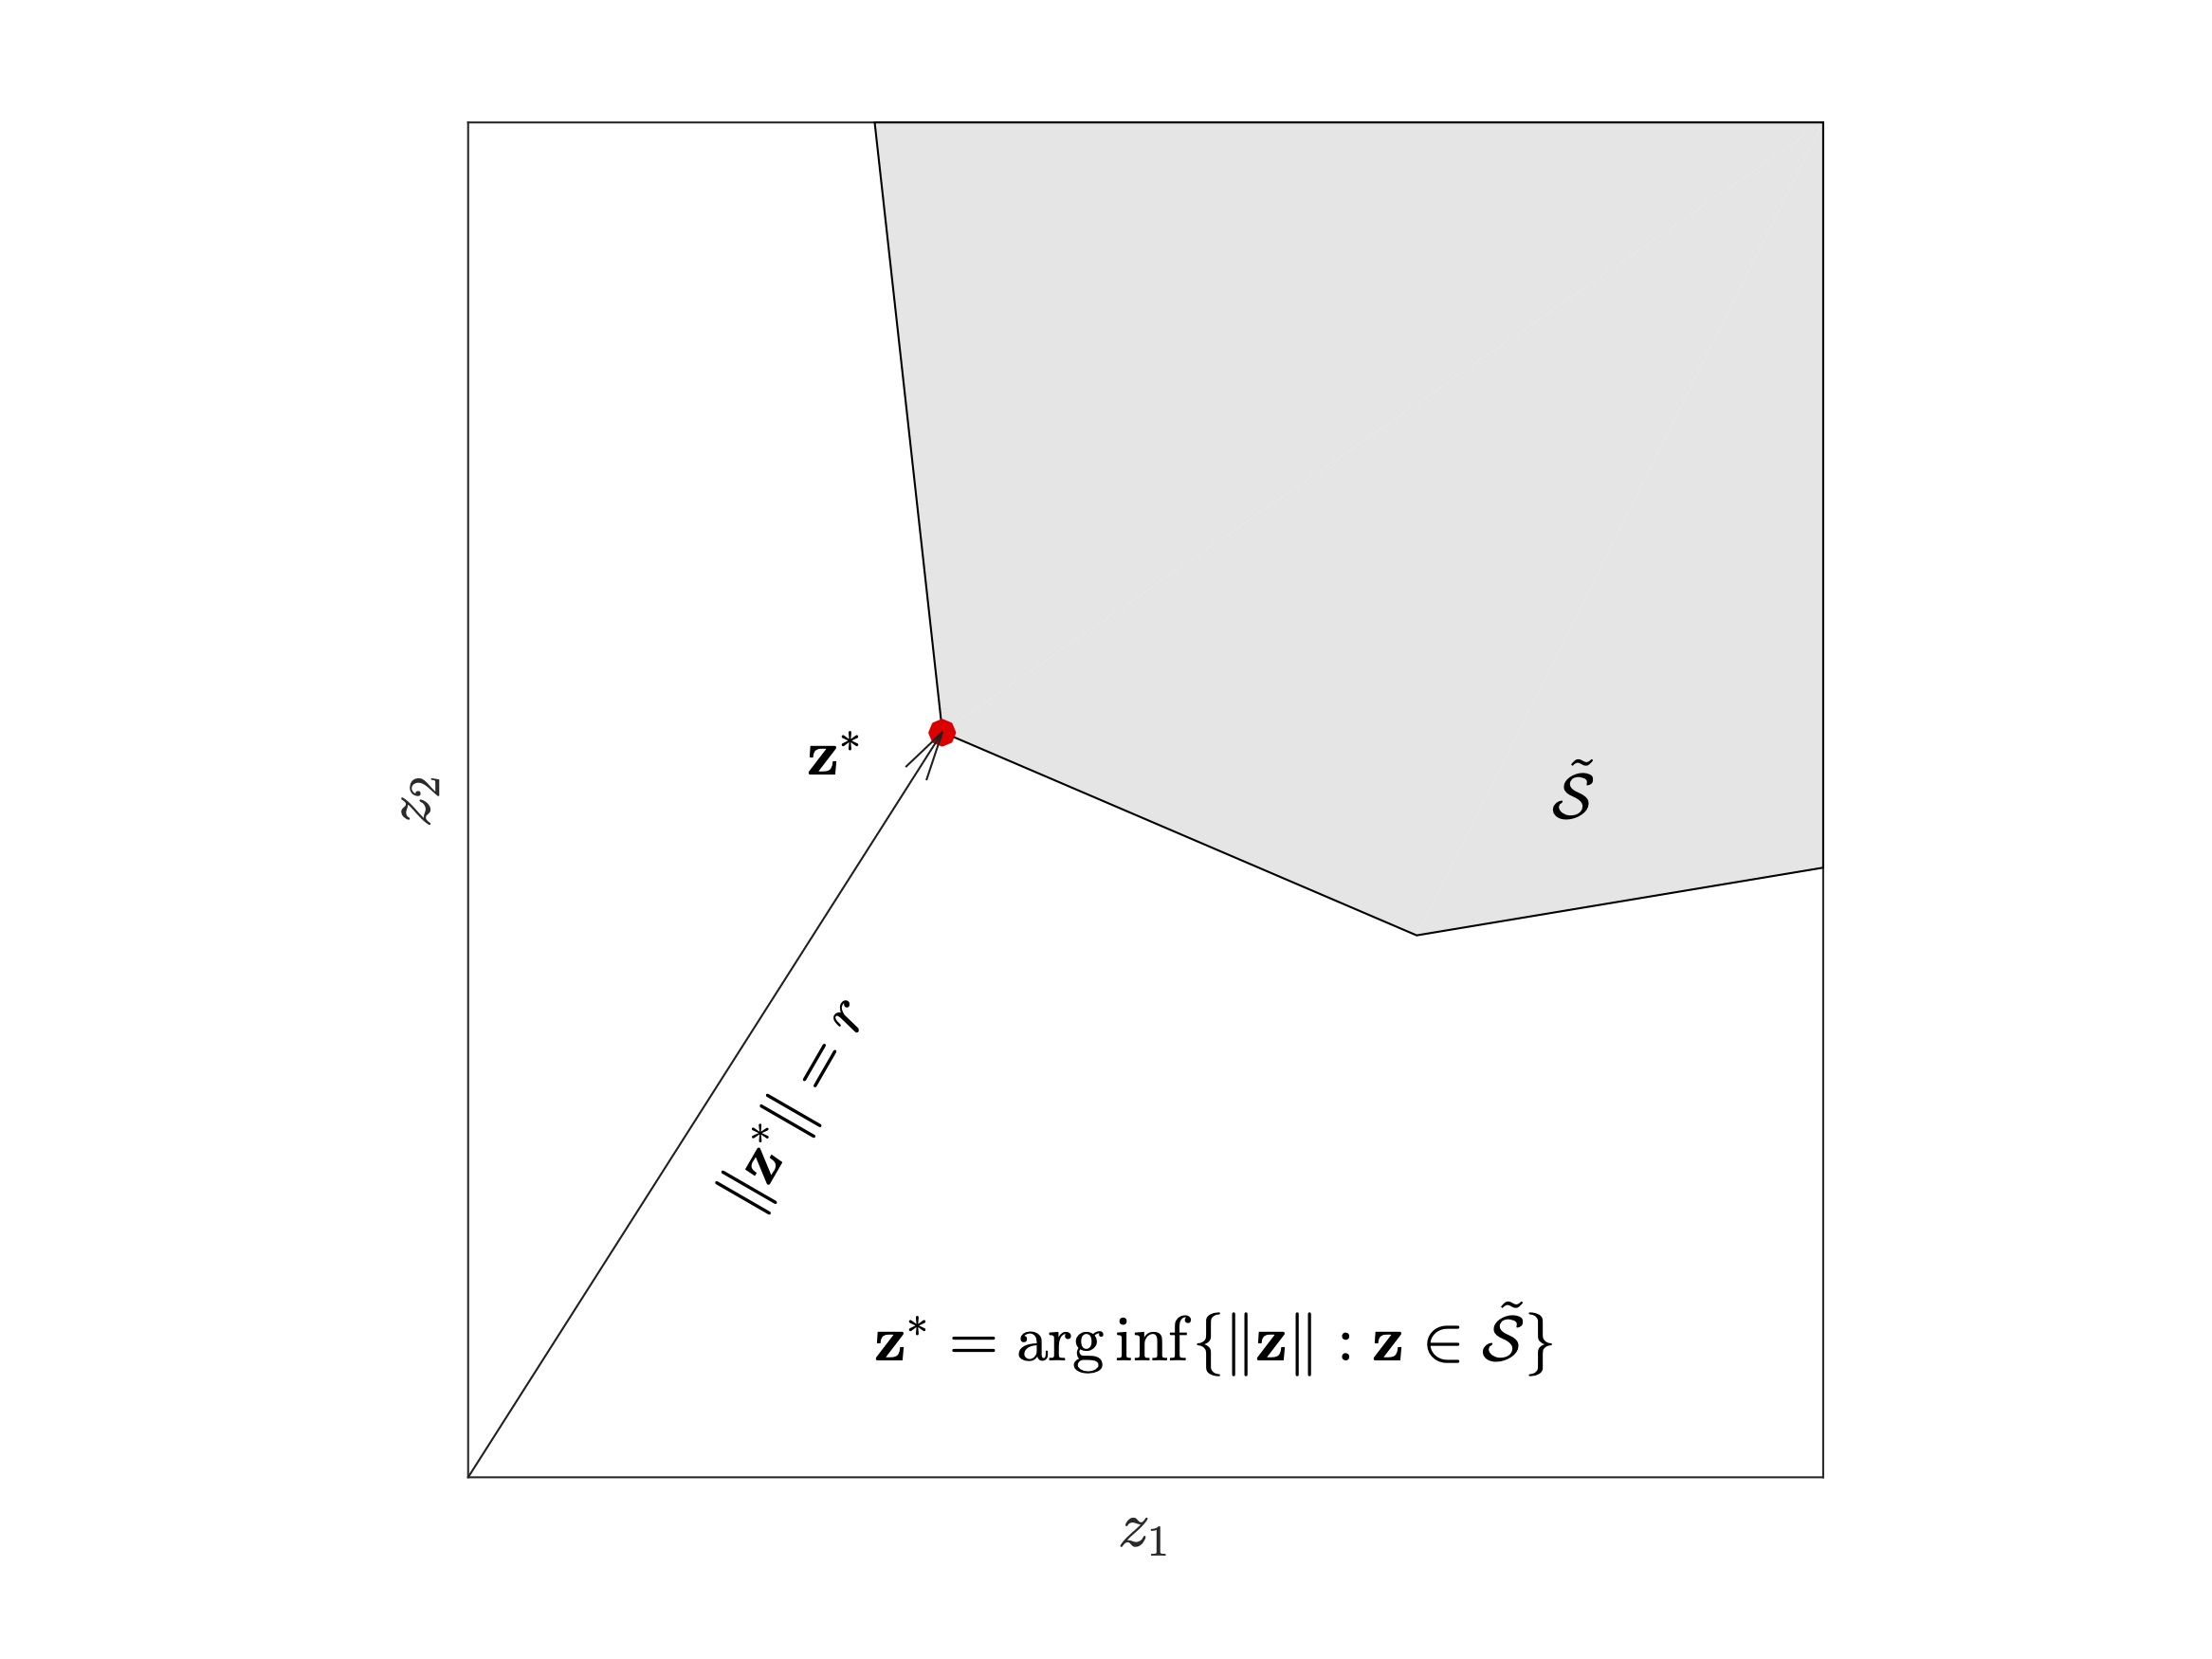 | 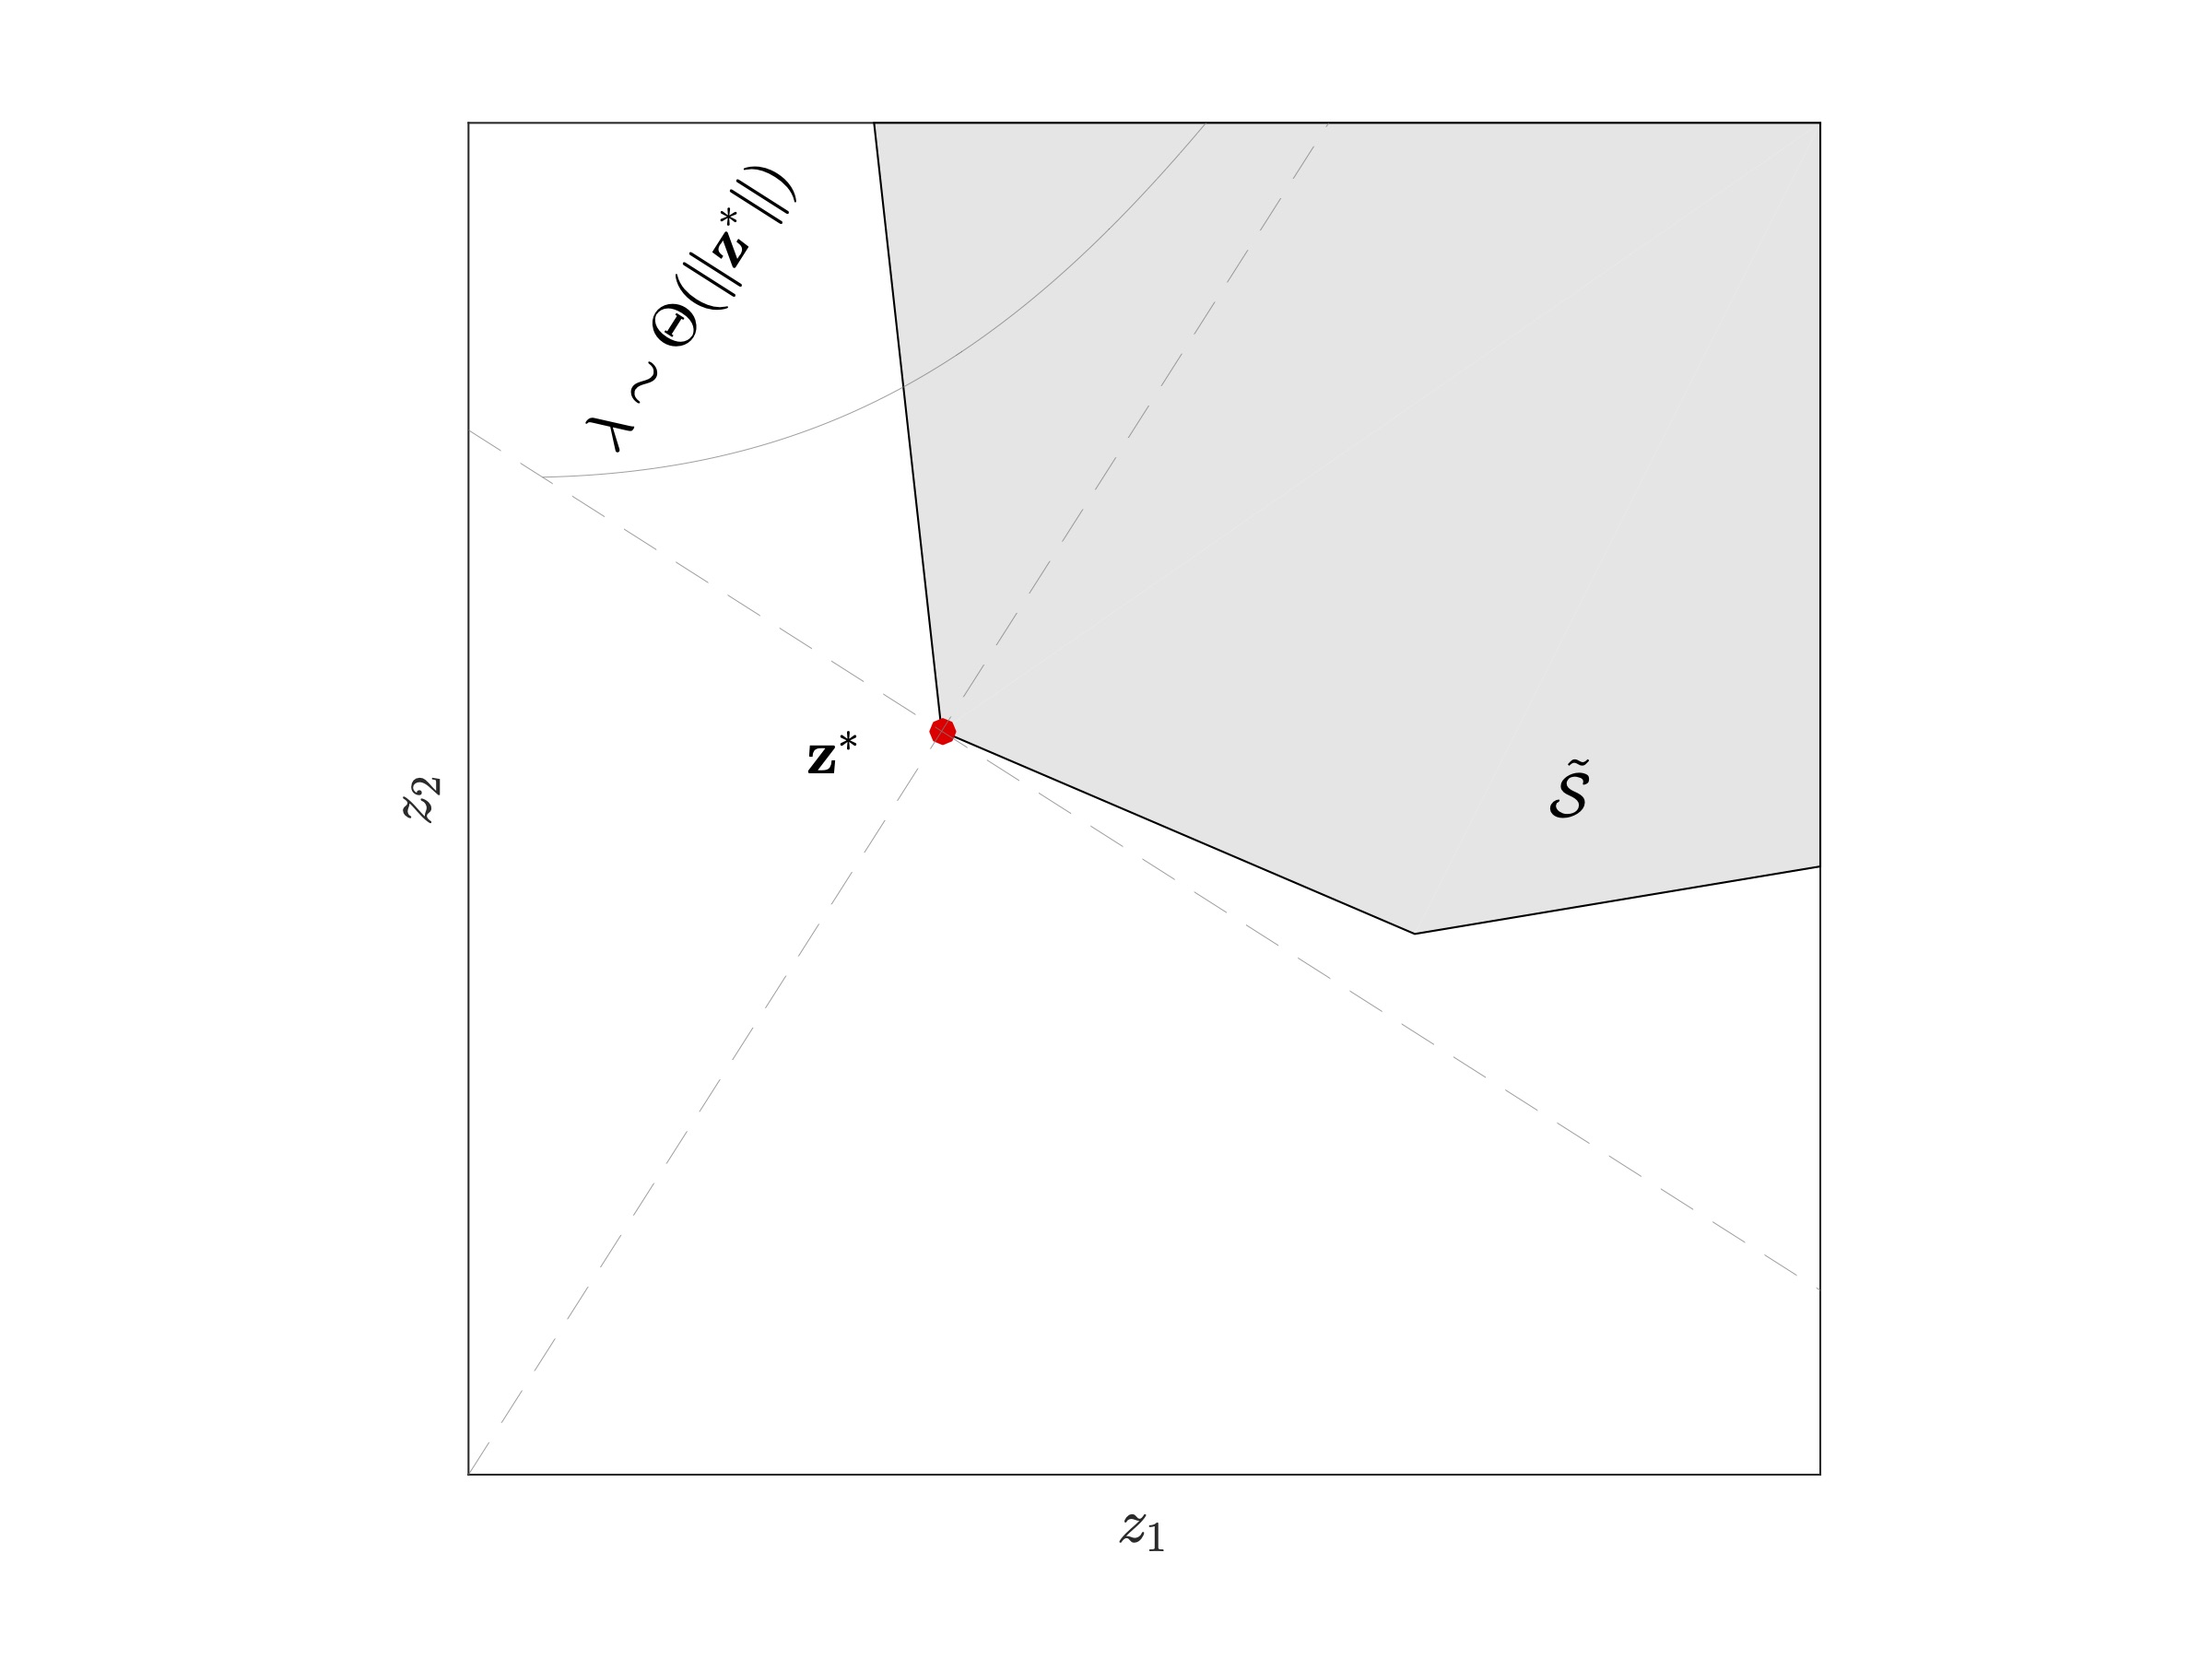 |
| Step 1: Identify the dominating point z* of the known constrained set (shaded area) associated with the rare-event involving the NORTA random vector Z. | Step 2: Generate a random variate from a shifted-exponentail distribution in the direction of z*. |
 | 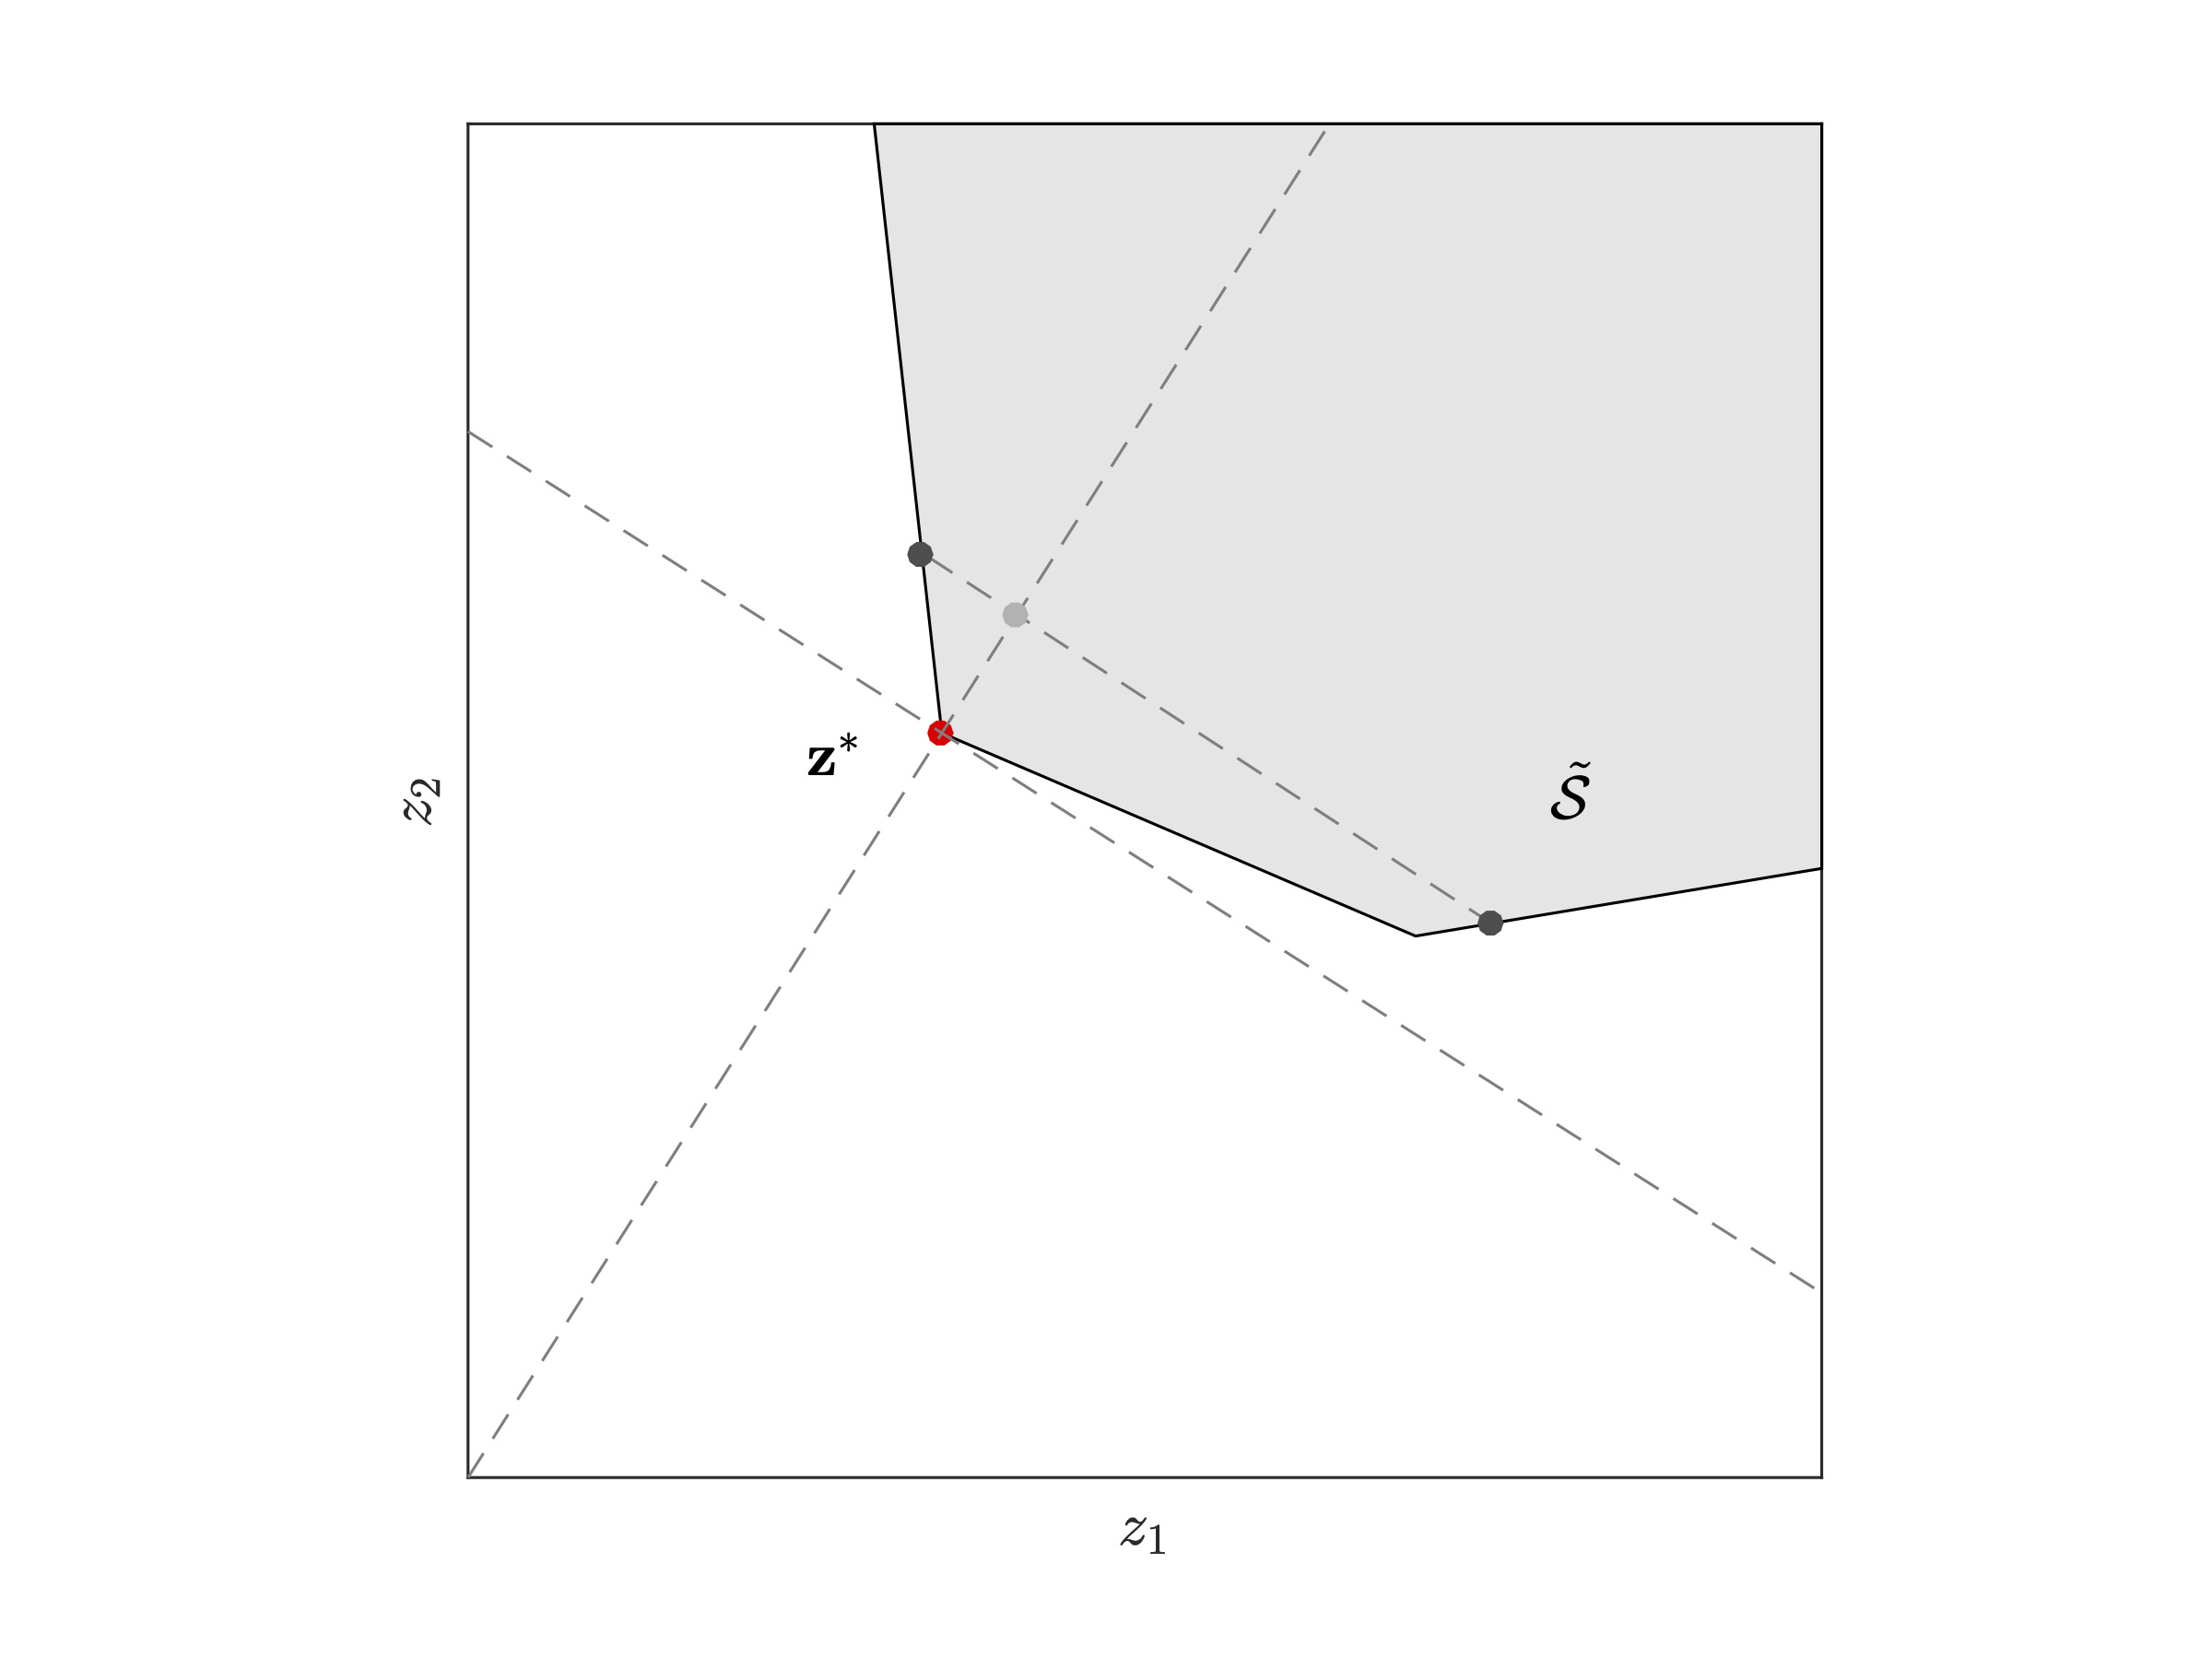 |
| Step 3: The parameter of this exponential distribution is of the order of the 2-norm of z*. The generated exponential random variate identifies just how far inside constrained set the sampled point lies. Larger the size of z*, closer the point will be to the set boundary. | Step 4: Next, to identify the remaining co-ordinates of the random vector, sample along all directionals orthogonal to z* and to each other at z*. |
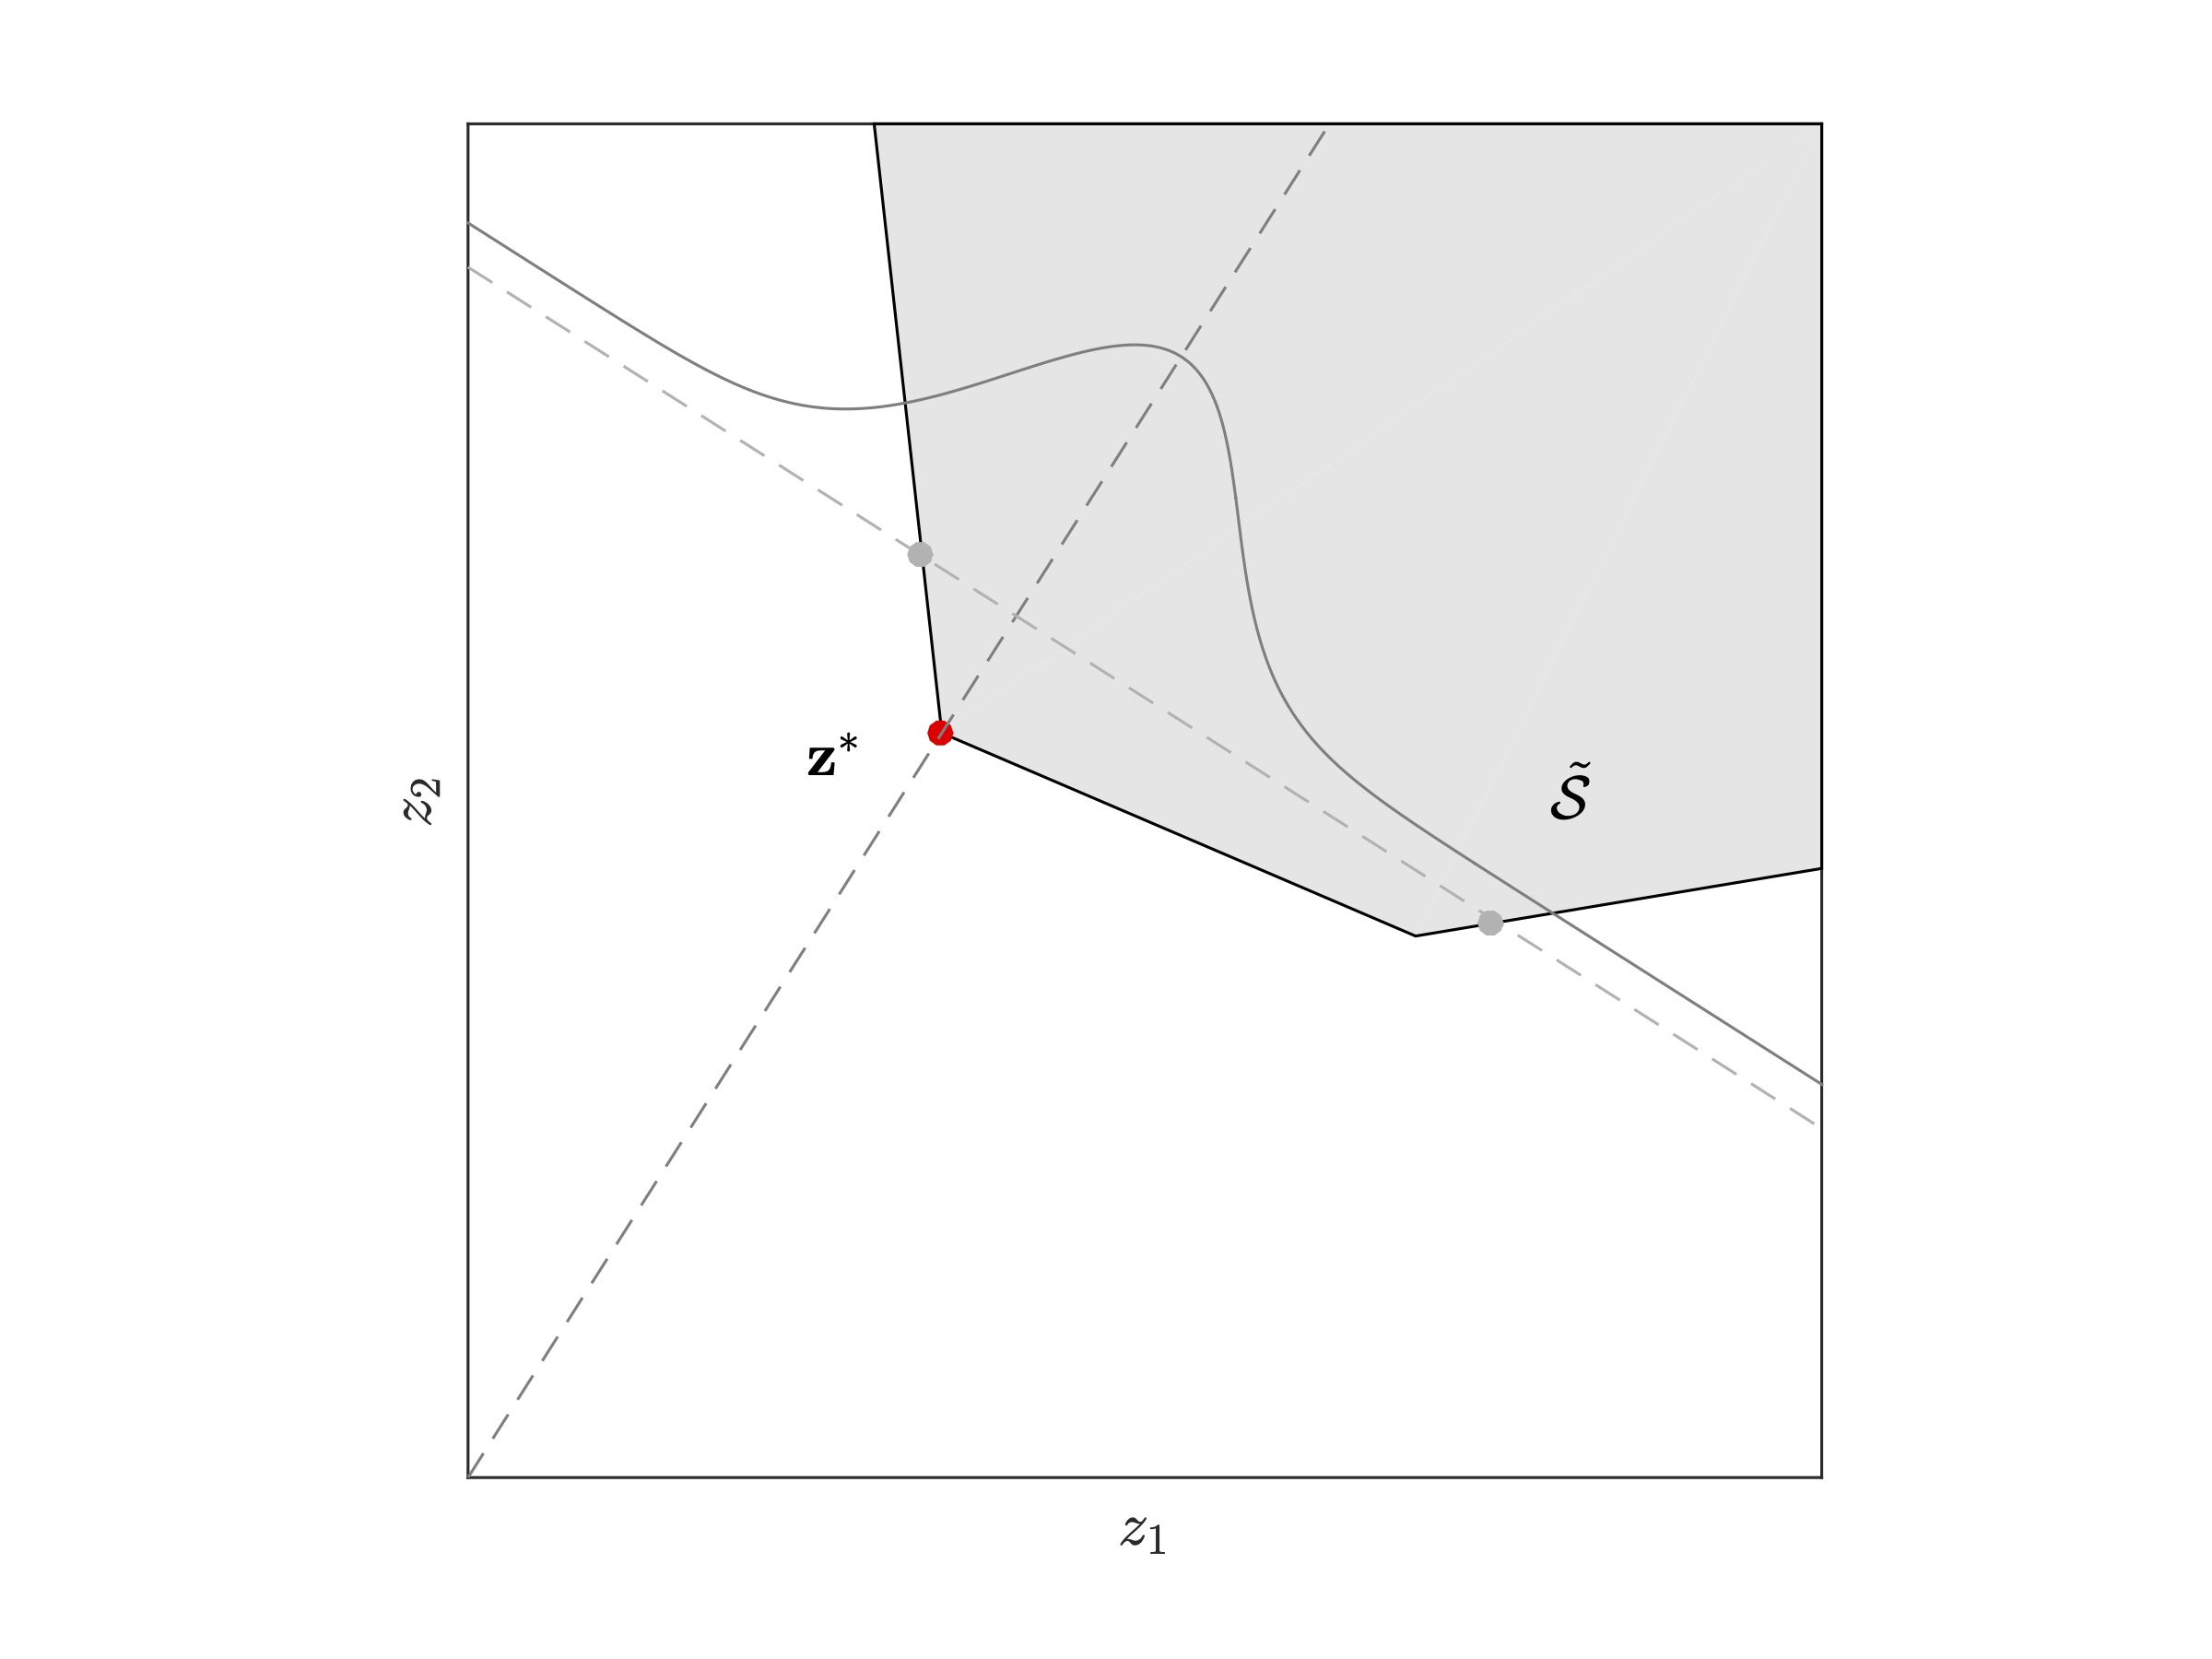 |  |
| Step 5: The remaining co-ordinates are sampled from the standard normal distribution and sampling will be constrained to intervals intersecting inside the constrained set. | Step 6: Generate several such random vector Z independently (one such random vector is indicated by a black star in the figure) to compute an estimate of the required rare-event quantity. |
| Figure 4: Steps to generate a random vector for the partial information estimator. |
Awards
Won second place (runner-up position) in the 2014 INFORMS Computing Society (ICS) Student Paper Competition
Positions in Academia
Assistant Professor, School of Industrial Engineering and Management, Oklahoma State University, 2016–2018
Visiting Assistant Professor, Department of Statistics, Purdue University, 2014–2016
Education
Ph.D., Industrial and Systems Engineering, Virginia Tech, 2014
M.S., Industrial and Systems Engineering, Virginia Tech, 2008
B.E., Cummins College of Engineering for Women, University of Pune, 2007